905-892-8920         info@teambb.ca   

Tag Archives: Niagara Realty Source

Cannabis Legalization and Real Estate Disclosure Requirements

What happens with real estate transactions involving a home that has had this number of cannabis plants grown within it? On October 17, 2018, it became legal to purchase small amounts of marijuana and grow up to four plants per residence (not per person) in Ontario. Nonetheless, the prospect of purchasing a home that has…
Read More

SOLD! Handyman Special in Pelham

  • filename-1-1
  • filename-1-2
  • filename-1-3
  • filename-1

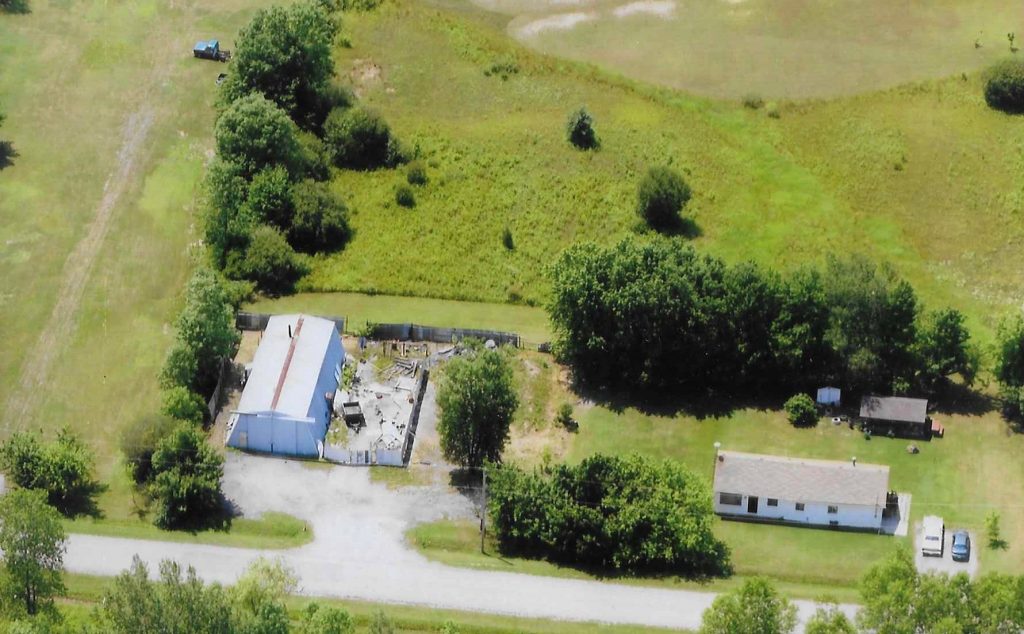
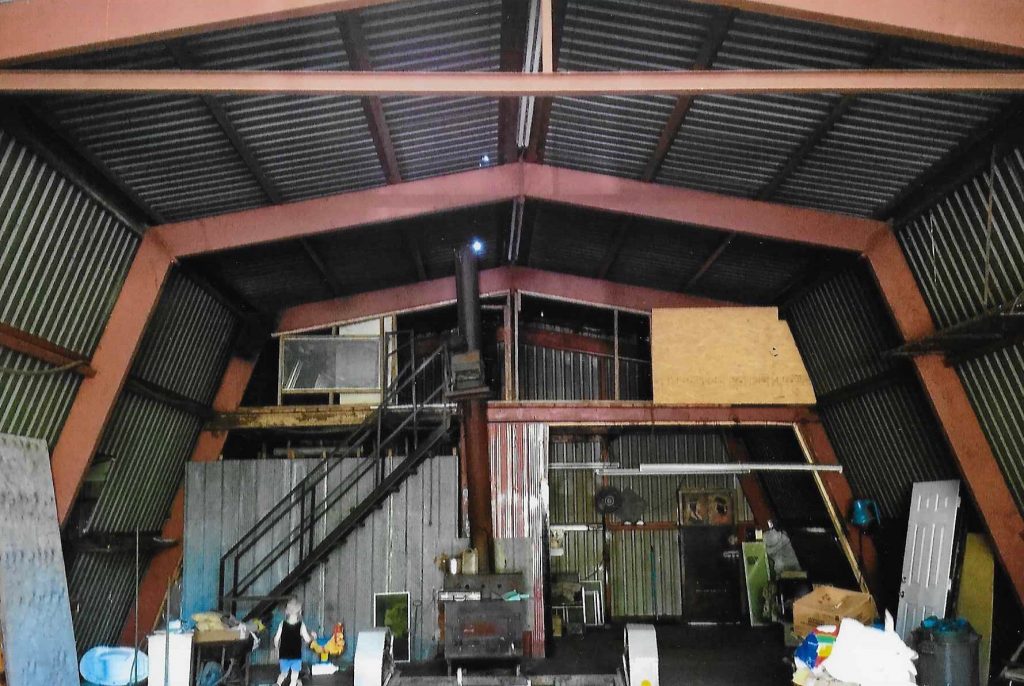
434 Pihach Rd., Fenwick 320 ft Frontage & 117 ft Depth ( .86 acre property); 40x60 metal shop with hydro; 3 bedroom bungalow needs TLC

Niagara Home Sales Hot this Summer

It has been an active summer for real estate sales across the Niagara Region with 2994 unit sales reported during the months of June, July and August in the communities serviced by the Niagara Association of REALTORS®. This figure reflects a gain of 15.7% over last year’s total of 2588 transactions during the same three…
Read More

Niagara Home Sales UP 32.7% in February!

The Niagara Association of REALTORS® (NAR) reported 605 property sales processed through the NAR Multiple Listing Service (MLS®) system in February 2016. This represents a 32.7% increase in sales over February of last year. The residential average sale price of $289,841 was 12.6% higher than last February. The average days on market decreased from 65…
Read More

Niagara Real Estate Market Report – February 2015

The Niagara Association of REALTORS® (NAR) reported 455 property sales processed through the NAR Multiple Listing Service (MLS®) system in February. This represents an increase of 1.8% in sales over February of last year. The residential average sale price of $256,525 was 5.8% higher than last February. The average days on market decreased from 75…
Read More

How Much Do You Need to Earn to Buy a Home in Our Local Area?

We just read an interesting article just published on Workopolis: How much you need to earn to buy a house in every major Canadian city? Click here to read full article Using the same criteria outlined in the Workopolis analysis the figures for our local market are as follows: (The Welland and Pelham 12-Month Average…
Read More

Niagara Association of REALTORS® November Market Report

December 9, 2014, Niagara - The Niagara Association of REALTORS® (NAR) reported 527 property sales processed through the NAR Multiple Listing Service (MLS®) system in November. This represents an increase of 24% in sales over November of last year. The residential average sale price of $256,267 was 9.3% higher than last November. The average days…
Read More

AUGUST Market Update – Niagara Housing Sales UP 9.6%

It has been an active summer for real estate sales across the Niagara Region with 584 residential unit sales reported during the month of August in the communities serviced by the Niagara Association of REALTORS®. This figure reflects a gain of 9.6% over last August’s total of 533 transactions. Pelham home sales continued to climb…
Read More

Niagara Home Sales off to Brisk Start

The Spring Market has arrived early in Pelham this year. Local home buyers are not letting the cold weather slow down their house shopping plans. According to the MLS statistics of the Niagara Association of REALTORS® there were 26 residential sales reported in Pelham during January and February of this year – up 13% compared…
Read More

Niagara Association of REALTORS® February Market Report

March 11, 2014, Niagara - The Niagara Association of REALTORS® (NAR) reported 414 property sales processed through the NAR Multiple Listing Service (MLS®) system in February. This represents a 16.29 per cent increase in sales over February of last year. The residential average sale price of $233,101 was 0.38 per cent higher than last February.…
Read More

A CLOSE-UP LOOK at Niagara Home Sales

As we head into the home stretch of the year we thought it would be a good time to do a quick pulse check of local market stats: Total NIAGARA Residential Sales January 1 - November 30th, 2013: 5,935 Total NIAGARA Residential Sales January 1 - November 30th, 2012: 5,958 % CHANGE: -0.4% NIAGARA AVERAGE…
Read More