It has been an active summer for real estate sales across the Niagara Region with 2994 unit sales reported during the months of June, July and August in the communities serviced by the Niagara Association of REALTORS®. This figure reflects a gain of 15.7% over last year’s total of 2588 transactions during the same three months.
Year-to-date the picture in Niagara is shaping up to be a record breaker. So far this year there have been 7045 residential sales reported in Niagara – an increase of 18.8% over the total of 5932 unit sales recorded during January to August 2015. In comparison the totals for the past 5 years, 2014, 2013, 2012, 2011 and 2010 have been 5170, 4818, 4893, 5011 and 4919 respectively.
The Local Picture: Welland and Pelham
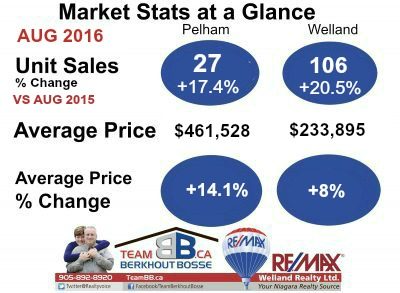
 Sales in the Rose City jumped 20.5% with 106 transactions reported this August compared to 88 in August 2015. Year-to-date sales total sales in Welland reached 780 units – up 26.2% from the total of 618 as at the end of August last year.
Pelham home sales continued to climb in August with 27 sales reported for the month compared to 23 in August 2015. According to the MLS statistics of the Niagara Association of REALTORS® there have been 176 units sold year-to-date in Pelham reflecting an increase of 14.3% over last year’s January to August sales total of 154 transactions.
Niagara Average Price UP 15%
The brisk sales activity is heating up average house prices throughout our Region. The Niagara 12-month average residential price reached $326,314 in August – up 15.0% over the August 2013 figure of $ $283,648.
The 12-month average price now stands at $233,895 in Welland reflecting an increase of 8.0% over last August’s figure of $216,479. In Pelham the 12-month average price rose 14.1% from $461,528 in August 2013 to $404,435 as of the end of August 2015.
