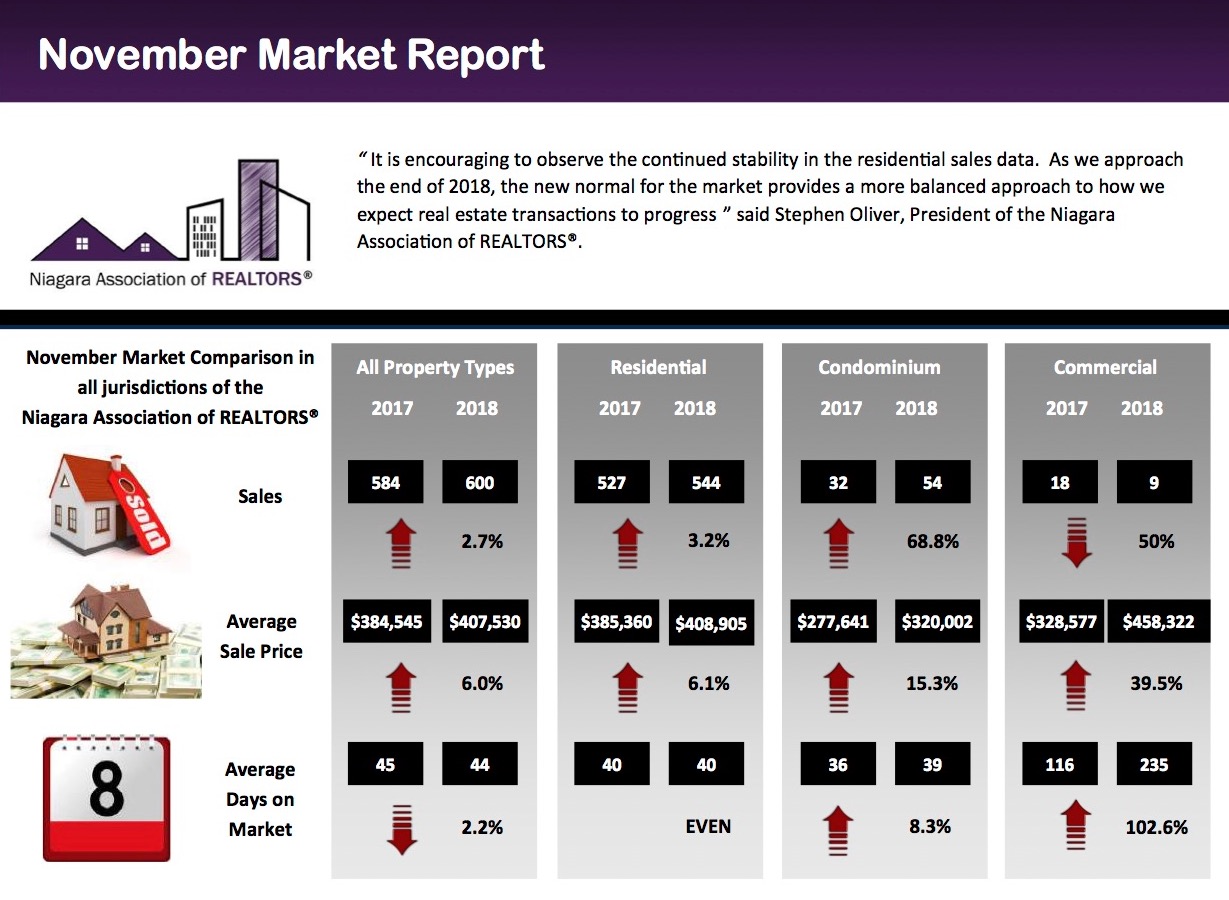
The Niagara Association of REALTORS® (NAR) reported 600 property sales processed through the NAR Multiple Listing Service (MLS®) system in November. This represents a 2.7% increase in sales compared to November of last year.
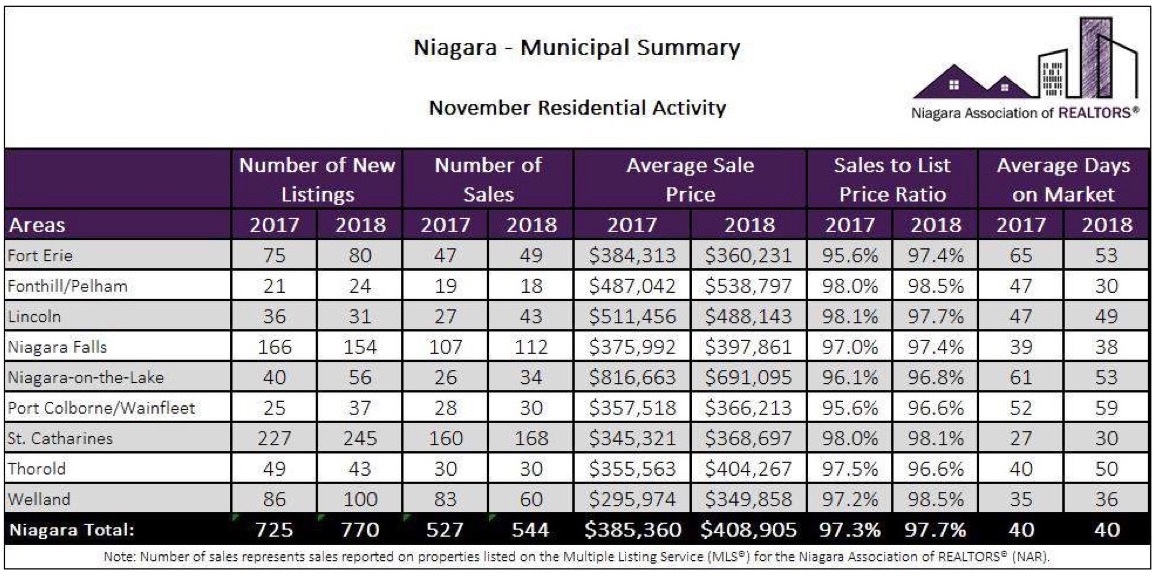
In Pelham and Welland, unit sales for the month were down 5.2% and 27.7% respectively.
In the residential freehold market, the average days on market were even to last year at 40. There was however an increase of 8.3% from 36 to 39 days in the condominium market from this time last year.
The Niagara residential average sale price of $408,905 had an increase of 6.1% versus last November while the number of active residential property listings increased by 18.9% versus November 2017.
Year to date, residential property transactions total 6,089 v.s. 6,921 for 2017 and 5,495 in 2013. This represents a decrease of 12.0% versus 2017 and an increase of 10.8% versus 2013.
In our local communities of Pelham and Welland the Year to date figures are as follows:
Pelham: -30.5% 196 (2018) vs 282 (2017)
Welland: -15.5% 804 (2018) vs 951 (2017)
Despite the trend of an increase in the average days to sell v.s 2017, it is worth noting that the current average of 38 days to sell is 32.1% lower versus the 56 average days to sell at this time in 2015. The sales price to list price ratio of 97.8% versus 99.3% in 2017 remains relatively steady.
“It is encouraging to observe the continued stability in the residential sales data. As we approach the end of 2018, the new normal for the market provides a more balanced approach to how we expect real estate transactions to progress.” said Stephen Oliver, President of the Niagara Association of REALTORS®.
Please refer to the accompanying charts for market activity in select areas in NAR’s jurisdiction.


